Running large language models locally is still mostly a hobbyist luxury 16 GB+ of VRAM, high-end desktop GPUs, noisy fans. But small language models (2–4B parameters) change the equation entirely. They fit in 4 GB of VRAM, run on a laptop, and for many everyday tasks they're good enough. The question I wanted to answer: which one is actually best, and on what tasks?
Hardware & Setup
All benchmarks ran on an RTX 3050 Laptop GPU (4 GB VRAM) with 16 GB DDR5 RAM. Ollama version 0.3.x managed model loading, context window, and inference. The benchmark harness called Ollama's REST API and measured wall-clock timings directly no driver-level profiling.
The Three Models
All three were chosen because they fit in 4 GB VRAM with a comfortable context window. Qwen2.5 is Alibaba's latest small model; Gemma2 is Google DeepMind's; Llama3.2 is Meta's. Three different training recipes, three different architecture choices.
The 6 Prompt Categories
Each model was evaluated on 20 prompts spread across 6 categories chosen to cover the real use-cases where you'd actually reach for a local model:
- Reasoning multi-step logical deduction, analogies
- Coding write a function, explain a snippet, find a bug
- Factual geography, history, science questions with known answers
- Maths arithmetic, algebra, word problems
- Summarisation condense a passage to key points
- Instruction-following format a list, write in a specific style
The 5 Scoring Strategies
No single scoring method works for all categories. The harness uses a category-aware scorer that picks the right strategy automatically:
| Scorer | How it works | Used for |
|---|---|---|
| Keyword overlap | Checks presence of expected key terms in output | Factual, Reasoning |
| Exact match | String equality after normalisation | Maths, short Factual |
| Code fence | Parses fenced code blocks, validates syntax | Coding |
| Structural | Word count, line count, list formatting | Instruction-following |
| ROUGE-1 | Unigram overlap between output and reference | Summarisation |
Measuring TTFT & Throughput
Time to First Token (TTFT) matters as much as total speed for interactive use. A model that generates 25 tokens/sec but takes 4 seconds to start feels much slower than one that starts in 300 ms and generates 18 tokens/sec. The harness measures both separately:
import httpx, time

async def measure(model: str, prompt: str) -> dict:
    t0 = time.perf_counter()
    first_token_time = None
    tokens = 0

    async with httpx.AsyncClient() as client:
        async with client.stream("POST", "http://localhost:11434/api/generate",
            json={"model": model, "prompt": prompt}) as r:

            async for chunk in r.aiter_lines():
                if first_token_time is None:
                    first_token_time = time.perf_counter() - t0
                tokens += 1

    total = time.perf_counter() - t0
    return {
        "ttft": first_token_time,
        "throughput": tokens / total,
        "total_s": total
    }
Results
| Model | Avg quality score | Avg TTFT (ms) | Avg tokens/sec |
|---|---|---|---|
| Qwen2.5:3B | 0.74 ★ | 410 | 18.2 |
| Gemma2:2B | 0.61 | 290 ★ | 26.8 ★ |
| Llama3.2 | 0.67 | 380 | 21.4 |
Qwen2.5:3B ranked #1 on quality particularly dominant on coding (+18 pts over Gemma2) and reasoning (+12 pts). It also handled instruction-following better than either competitor. Gemma2:2B is the speed champion 47% lower TTFT than Qwen2.5 and 47% higher throughput. For latency-sensitive interactive use, Gemma2 wins. Llama3.2 is the middle ground decent on both axes, best at nothing.
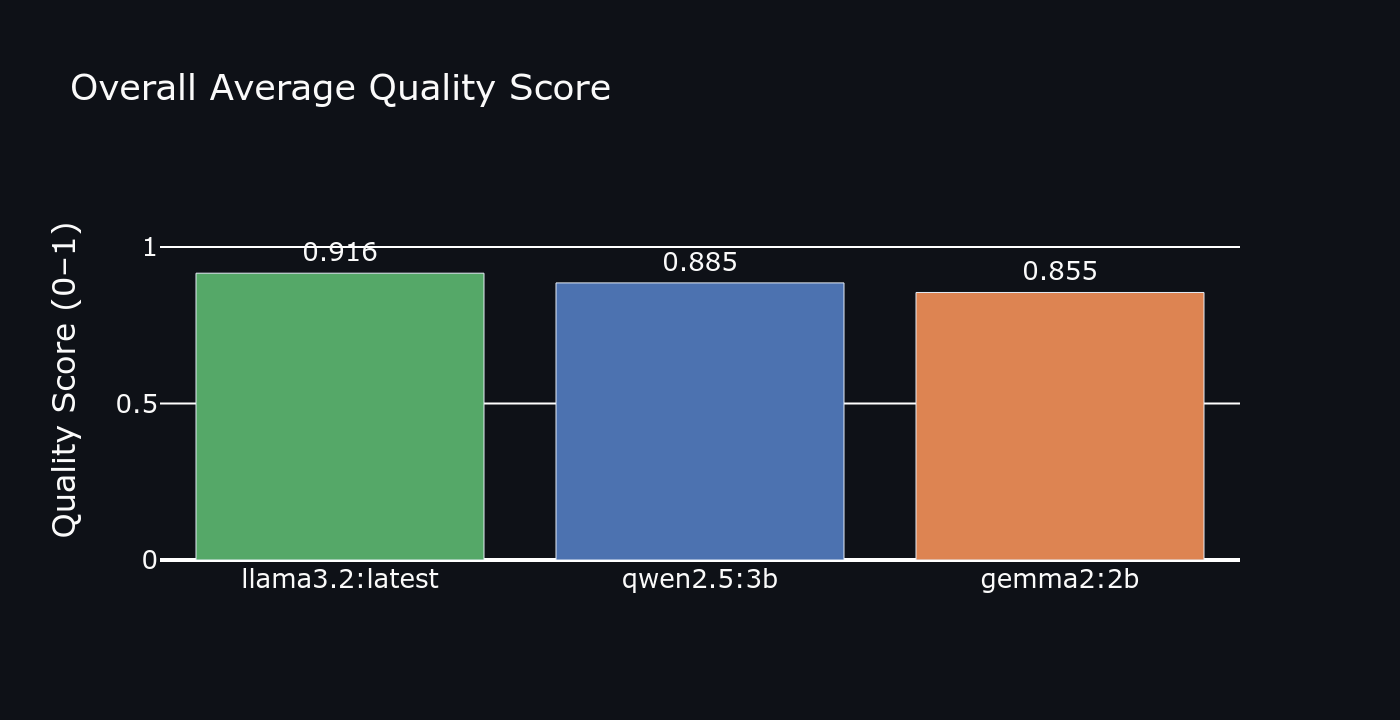 Overall quality score
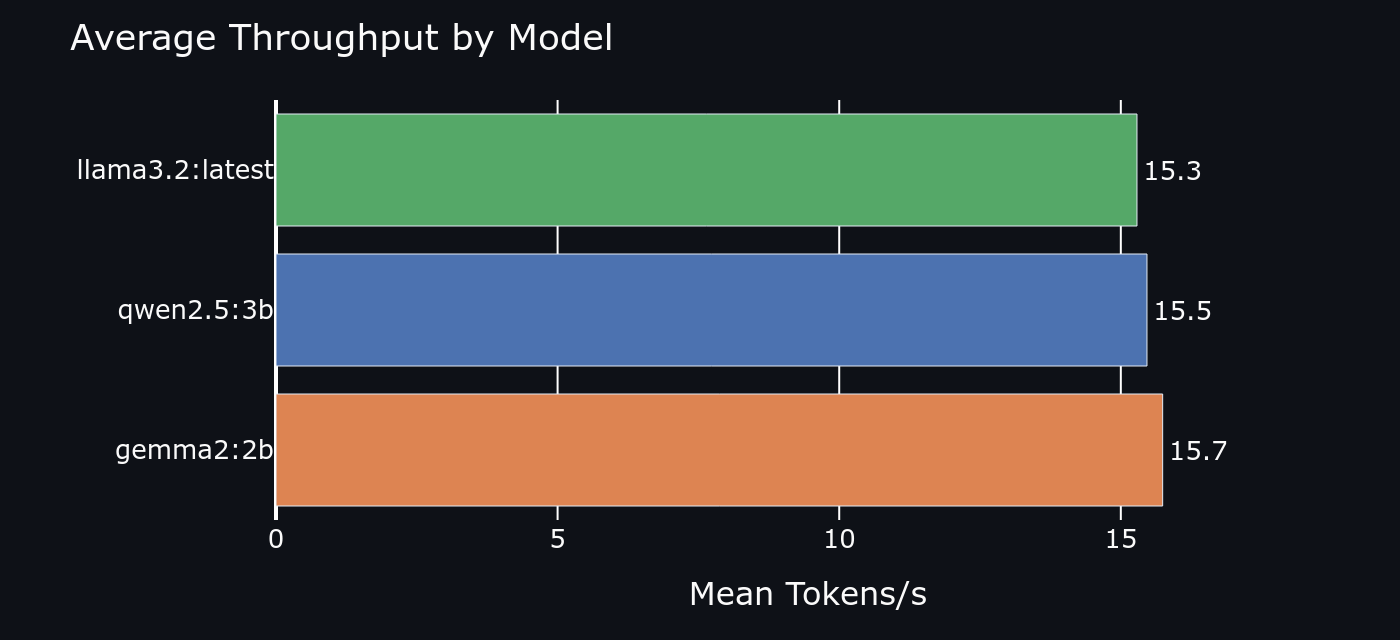 Average throughput (tokens/sec)
Category Breakdown: Where Each Model Wins
- Coding: Qwen2.5 by a wide margin it reliably produces runnable code with correct syntax
- Maths: Qwen2.5 again Llama3.2 struggled with multi-step word problems
- Summarisation: Llama3.2 edges Qwen2.5 ROUGE scores were nearly tied but Llama produced tighter output
- Factual: Qwen2.5 Gemma2 had the highest hallucination rate in this category
- Instruction-following: Qwen2.5 precise format compliance on structured output tasks
- Speed wins always go to Gemma2 no contest on TTFT or throughput
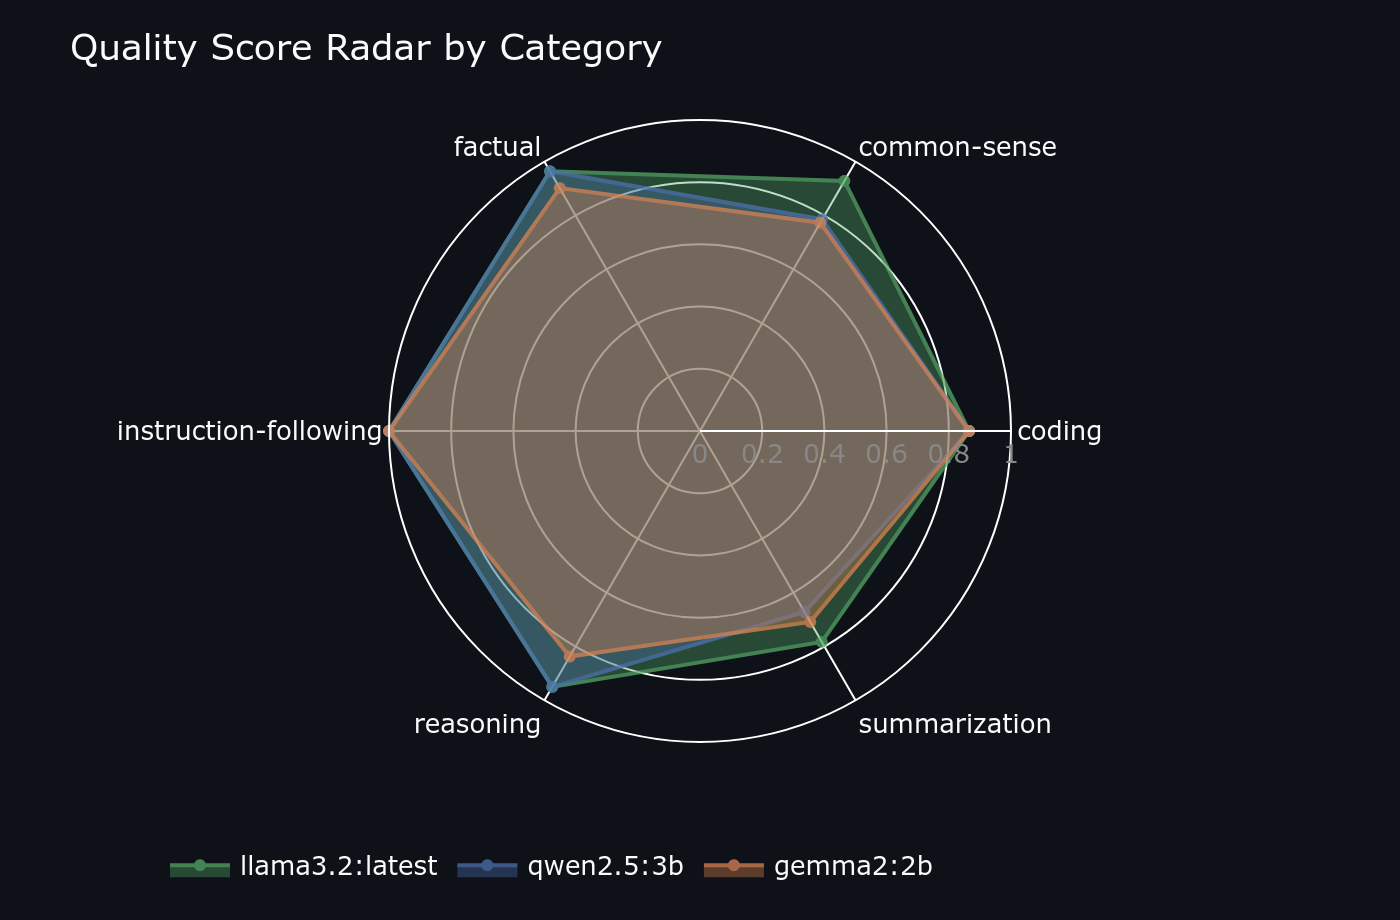 Quality radar per model strength profile
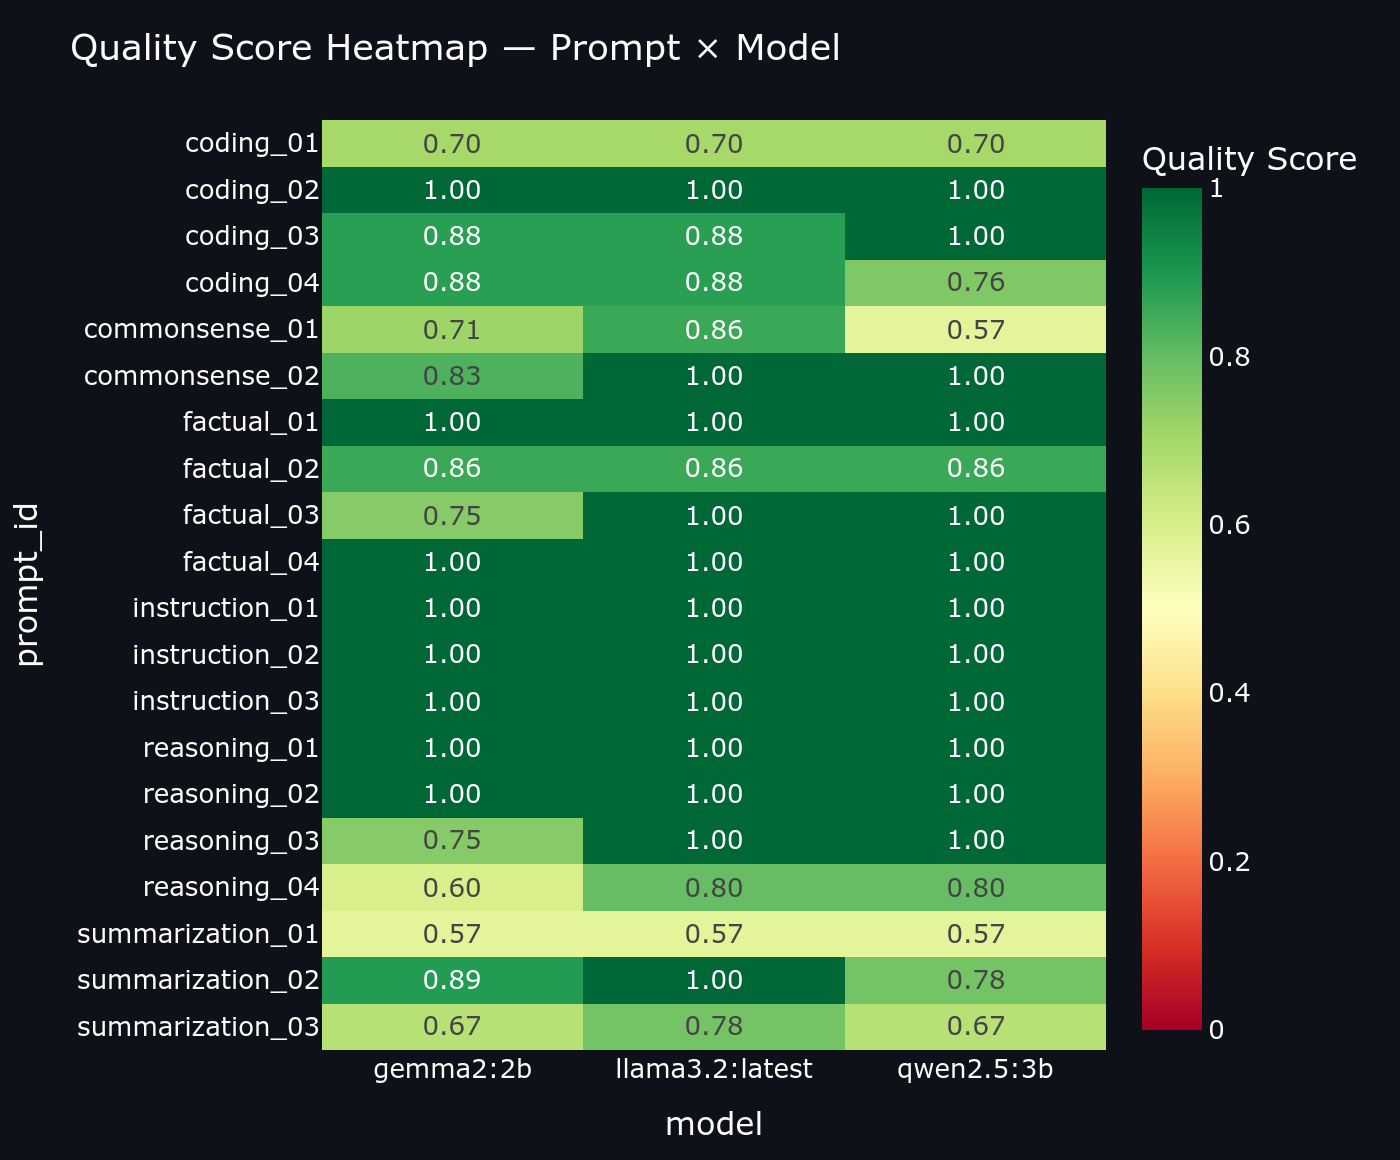 Quality heatmap per prompt
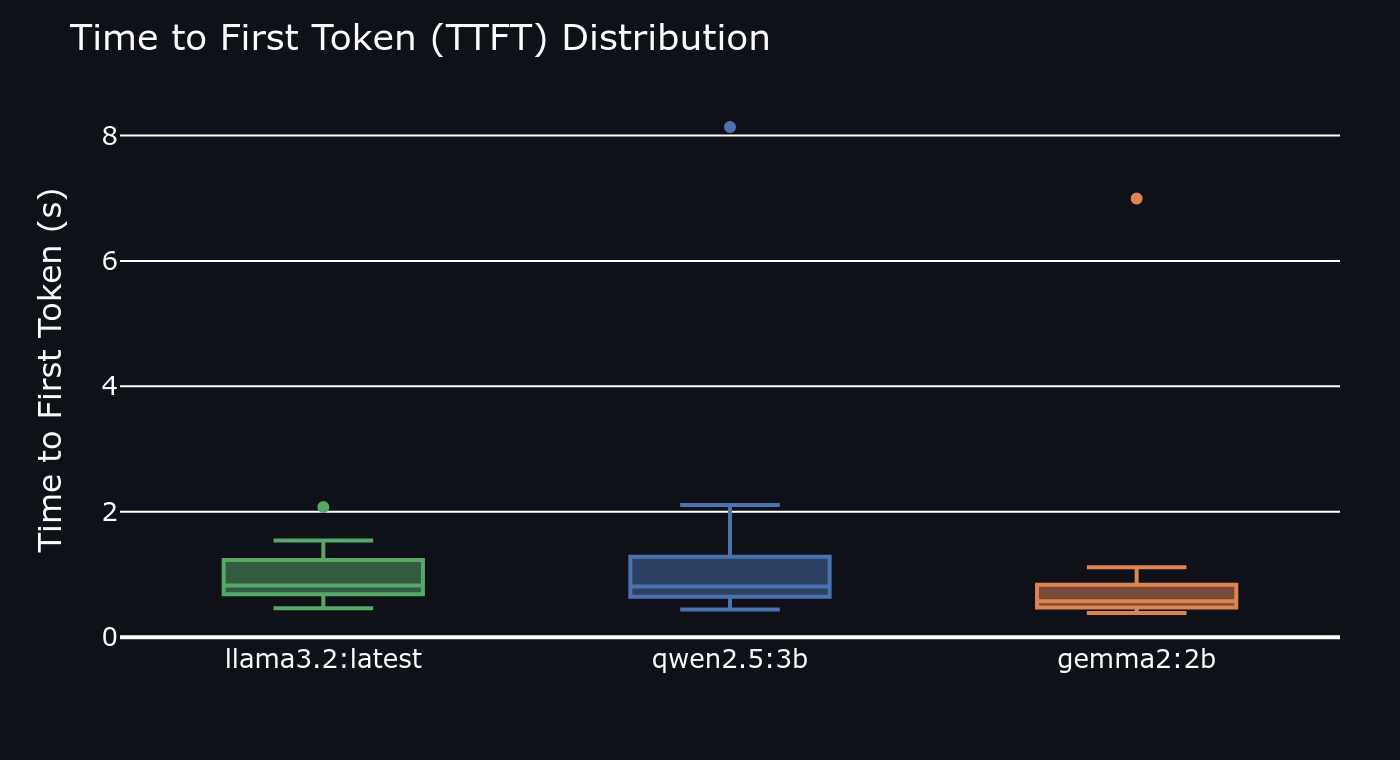 Time-to-first-token distribution (lower is better)
The Streamlit Dashboard
Raw numbers are hard to reason about across 6 categories and 3 models. The dashboard makes the data navigable through four views:
- Radar chart per-model quality profile across all 6 categories simultaneously
- Quality heatmap model × category grid with colour intensity showing score
- TTFT box plot distribution of first-token latency per model across all prompts
- History browser individual prompt/response pairs with raw scores, sortable by model and category
What I'd Improve
- Add Phi-3.5-mini Microsoft's 3.8B model is a strong Qwen2.5 challenger on reasoning
- Add LLM-as-judge scoring alongside ROUGE automated rubric scoring via a stronger model would catch nuances keyword overlap misses
- Run each prompt 3× and report median to reduce variance from thermal throttling
- Export results to Parquet so the dashboard can load historical runs for trend analysis